
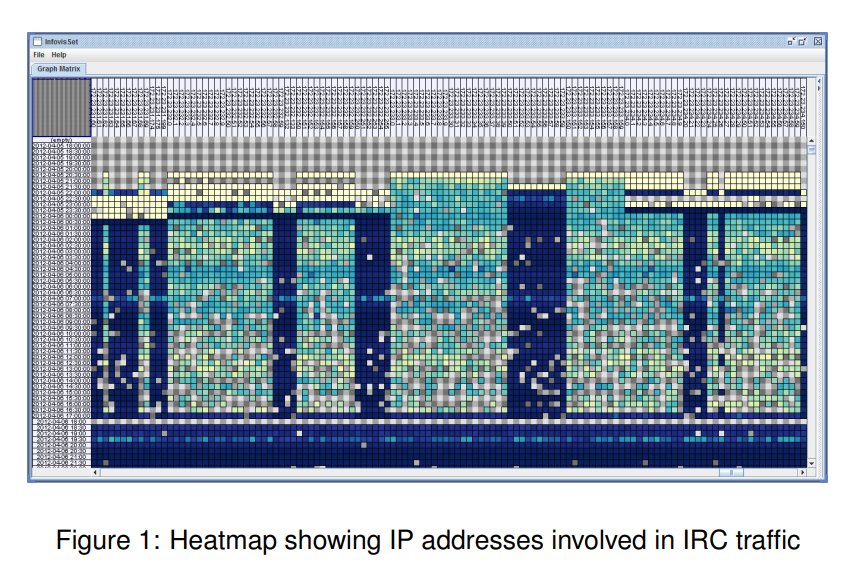
Visual analytics for network security
To visualize the VAST 2012 Mini Challenge 2 datasets, we use the InfoVis Toolkit (IVTK). Custom visualizations as well as extra interaction capabilities have been added to the toolkit. Custom-made Python scripts are used for data preprocessing purposes. In this work, we show how visualization tools may be combined to leverage network forensic analysis tasks. © 2012 IEEE.